14 posts tagged with "netdata"

View All Tags

· 10 min read
Hugo Valente

IoT Network

With the increasing prevalence of IoT devices, which are being used in a wide range of applications, from smart homes and cities to industrial and agricultural systems, monitoring thei performance and health is extremely important. However, it’s essential to remember that monitoring IoT devices involves more than just tracking device-level data. In addition, monitoring data from the IoT platform or application layer is equally important.

We’ll explore some of these topics in more detail and explain how Netdata can play an essential role in the monitoring of such devices, including some hints on how it can be set up for maximum performance in such scenarios.
· 2 min read
Satyadeep Ashwathnarayana

Alerts Configuration Manager Netdata introduces its latest feature, the Alerts Configuration Manager, transforming the way users configure and manage alerts in their Netdata environment. This powerful tool integrates directly into the Netdata Dashboard, offering a streamlined and intuitive interface for both novice and experienced users.
· 5 min read

The Netdata Methodology

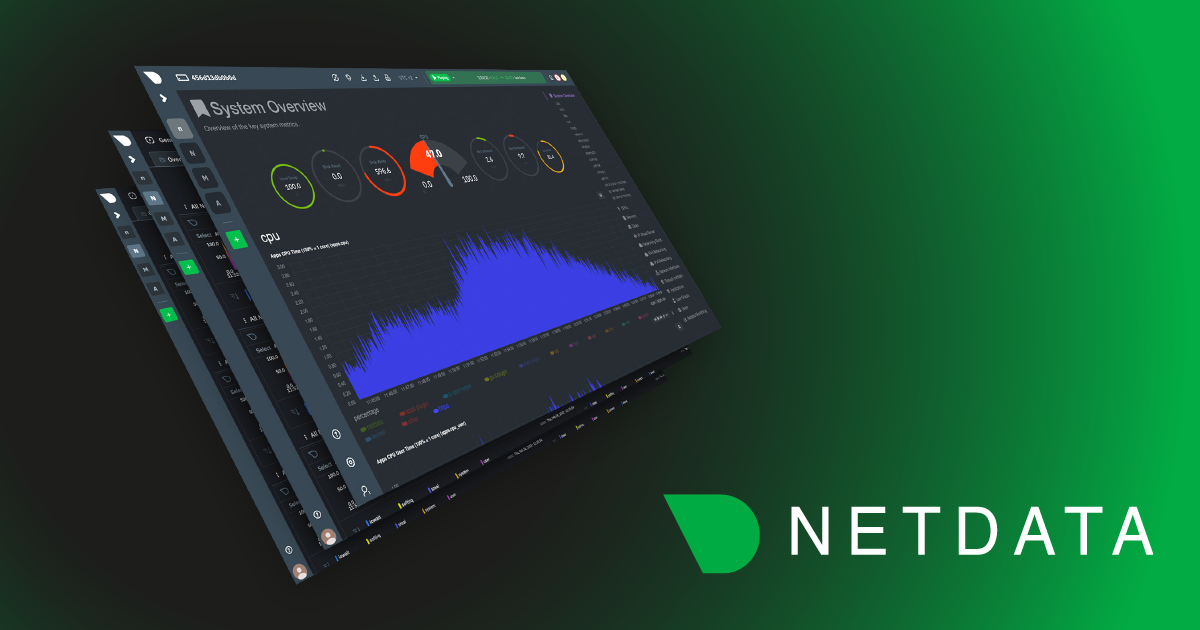
In the dynamic landscape of modern infrastructure and multi cloud environments, observing and understanding system performance requires a new breed of tools—ones that keep pace with the 'living' nature of modern infrastructure. This is the inflection point at which Netdata steps in, and aims to bring a fresh perspective to monitoring.

· 13 min read

Netdata Best Practices

Effective system monitoring is non-negotiable in today's complex IT environments. Netdata offers real-time performance and health monitoring with precision and granularity. But the key to harnessing its full potential lies in the optimization of your setup. Let’s ensure you are not just collecting data, but doing it in the most optimal way while gaining actionable insights from it.

· 14 min read
Costa Tsaousis

Netdata Prometheus Comparison

In an era dominated by data-driven decision making, monitoring tools play an indispensable role in ensuring that our systems run efficiently and without interruption. When considering tools like Netdata and Prometheus, performance isn't just a number; it's about empowering users with real-time insights and enabling them to act with agility.

There's a genuine need in the community for tools that are not only comprehensive in their offerings but also swift and scalable. This desire stems from our evolving digital landscape, where the ability to swiftly detect, diagnose, and rectify anomalies has direct implications on user experiences and business outcomes. Especially as infrastructure grows in complexity and scale, there's an increasing demand for monitoring tools to keep up and provide clear, timely insights.

Our ambition is to be the simplest, fastest and most scalable solution in this domain. However, it's essential to approach it with modesty. A performance comparison between Netdata and Prometheus is not a race for the top spot but an exploration of where we stand today and where improvements can be made. Through this, we hope to drive innovation, ensure optimal performance, and ultimately deliver better value to our users.

· 11 min read
Satyadeep Ashwathnarayana

netdata-prometheus-grafana-stack

In this blog, we will walk you through the basics of getting Netdata, Prometheus and Grafana all working together and monitoring your application servers. This article will be using docker on your local workstation. We will be working with docker in an ad-hoc way, launching containers that run /bin/bash and attaching a TTY to them. We use docker here in a purely academic fashion and do not condone running Netdata in a container. We pick this method so individuals without cloud accounts or access to VMs can try this out and for it's speed of deployment.

· 3 min read
Shyam Sreevalsan

img

Hello, fellow data enthusiasts and Google Colab aficionados! Today, we're going to explore how to monitor your Google Colab instances using Netdata. Colab is a fantastic platform for running Notebooks, developing ML models, and other data science and analytics tasks. But have you ever wondered how your Colab instance is performing under the hood? That's where Netdata comes into play!

· 4 min read
Andrew Maguire

img

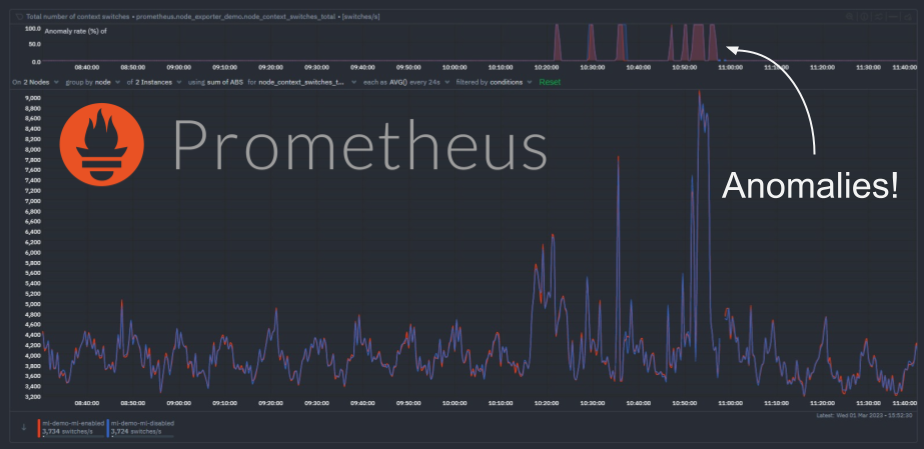
We have recently extended the native machine learning (ML) based anomaly detection capabilities of Netdata to support all metrics, regardless on their collection frequency (update every).

Previously only metrics collected every second were supported, but now Netdata can run anomaly detection out of the box with zero config on metrics with any collection frequency.

This post will illustrate an example of what this means using Prometheus metrics (via the Netdata Prometheus collector) since they typically have a default collection frequency of 10 seconds.

· 9 min read
Andrew Maguire

img

We recently got this great feedback from a dear user in our Discord:

I would really like to use Netdata to monitor custom internal metrics that come from SQL, not a fan of having 10 diff systems doing essentially the same thing as is, Netdata is pretty much all there in that regard, just needs a few extra features.

This is great and exactly what we want, a clear problem or improvement we could make to help make that users monitoring life a little easier.

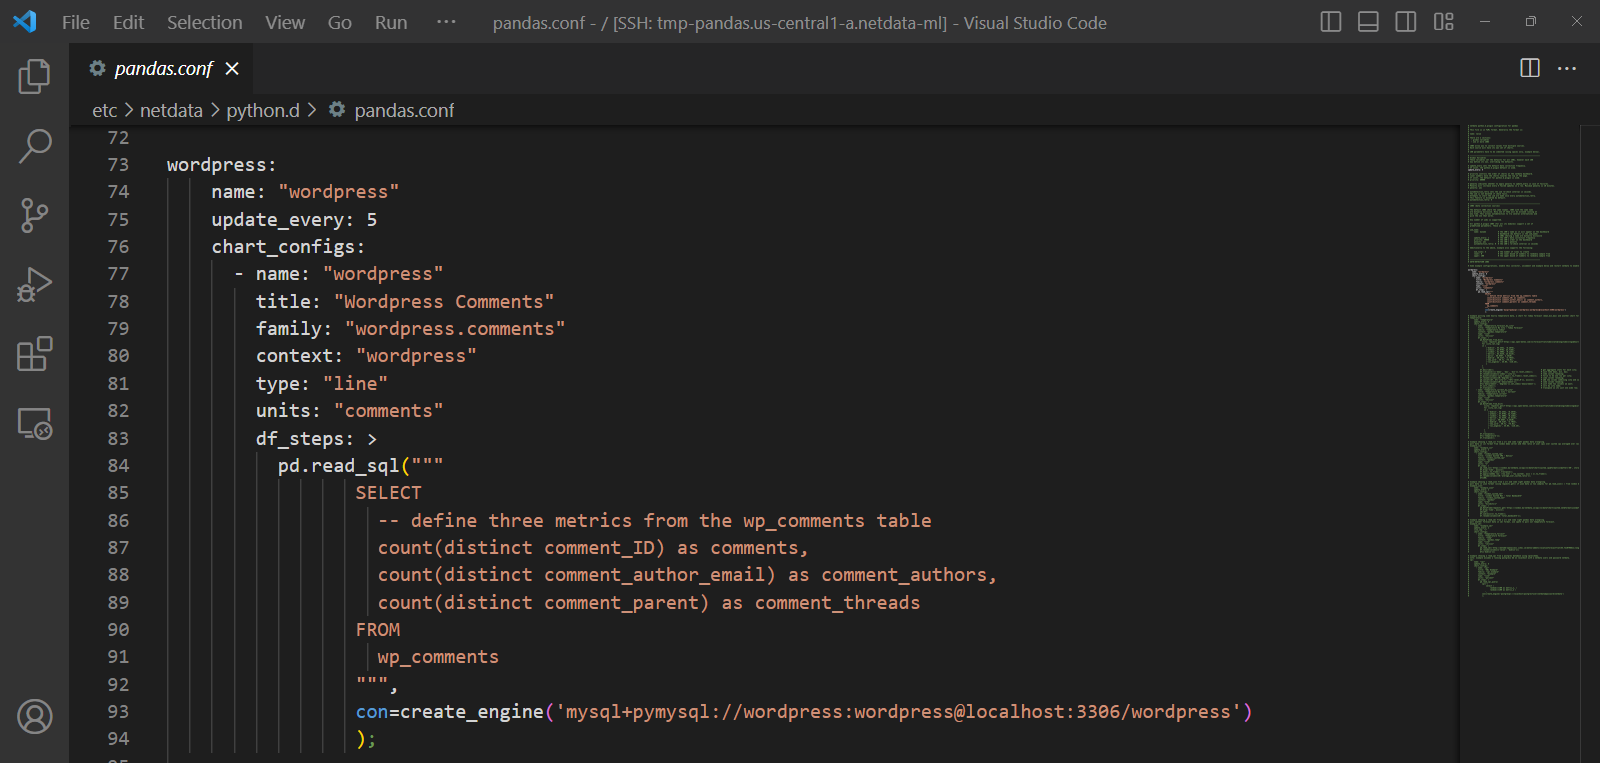
This is also where the beauty of open source comes in and being able to build on the shoulders of giants - adding such a feature turned out to be pretty easy by just extending our existing Pandas collector to support SQL queries leveraging its read_sql() capabilities.

Here is the PR that was merged a few days later.

This blog post will cover an example of using the Pandas collector to monitor some custom SQL metrics from a WordPress MySQL database.