Find out how to monitor your Internet speed and quality and how well your ISP is performing.

Monitoring ISP performance & Internet Speed
There's nothing quite as frustrating as a slow internet connection. Whether you're trying to stream a movie, download a large file, or just browse the web, a slow connection can make even the simplest tasks a pain. That's why it's important to keep an eye on your internet speed, and hold your ISP accountable if they're not providing the level of service they promised.
There are a number of online speed tests you can take to see how your internet is performing. But if you’ve ever tried them out, you’d know that speed tests can give varying results each time you run them and during different times of the day - so what you really need is to monitor the internet speeds your ISP is delivering.
So one-off speed tests on your browser are just not going to cut it. We need a way to continually monitor internet speed and visualize these results over time.
The tools we'll use
We’re going to use Ookla’s Speedtest CLI to run speed tests and collect key ISP performance. Ookla is pretty much the gold standard when it comes to speed tests and Speedtest CLI is a developer friendly linux native command line tool backed by Ookla.
And we will use Netdata to periodically collect the speed test metrics, visualize them as time series charts over time and do much more.
Installation
- Install Netdata
Sign up for a free Netdata account, and copy the command you see when you click on the “Connect Nodes” button.
Paste this command on your terminal to install Netdata.
- Install Speedtest CLI
sudo apt-get install curl
curl -s https://packagecloud.io/install/repositories/ookla/speedtest-cli/script.deb.sh | sudo bash
sudo apt-get install speedtest
If you are using another variant of Linux or FreeBSD or macOS use the appropriate installation commands mentioned in the Speedtest CLI website.
- Run Speedtest CLI as the Netdata user and accept the license agreements.
sudo -u netdata speedtest
- The Speedtest collector is a community maintained collector and not available as part of the Netdata agent by default. To install this collector just run this command:
sudo wget -O /tmp/install-collector.sh https://raw.githubusercontent.com/netdata/community/main/utilities/install-collector.sh && sudo bash /tmp/install-collector.sh charts.d.plugin/speedtest
After a few seconds, you see the new speedtest section in your Netdata Overview tab along with all of the Speedtest metrics being monitored by Netdata. As you will see, there’s a lot more than just your Download Speed and Upload Speed that we can monitor.
Key speed test metrics for ISP performance monitoring
Speed
Speed displays the download speed and upload speed that the speedtest was able to achieve, measured in Mbps. This is the most obvious measure of ISP performance that all users are aware of - and the easiest to check against what the ISP promised you when you made a contract with them.
The results below show my Internet speeds are pretty steady with upload speeds of roughly 10% of the download speeds. This is still significantly lower than what my ISP claims, so maybe it's time I had a chat with them.


Packet Loss
Packet Loss measures the percentage of packets dropped during the speed test,and should ideally be close to zero most of the time. Packet loss occurs when packets of data are lost in transit. This can happen for a number of reasons, including network congestion, faulty equipment, and bad weather. Packet loss can significantly impact a user's quality of experience, especially for applications such as VoIP and video calls and video streaming.
In my case, I see that the packet loss is zero most of the time, except for a few sporadic spikes of 20%(!!)... I should probably take a closer look at what's going on there.

Latency
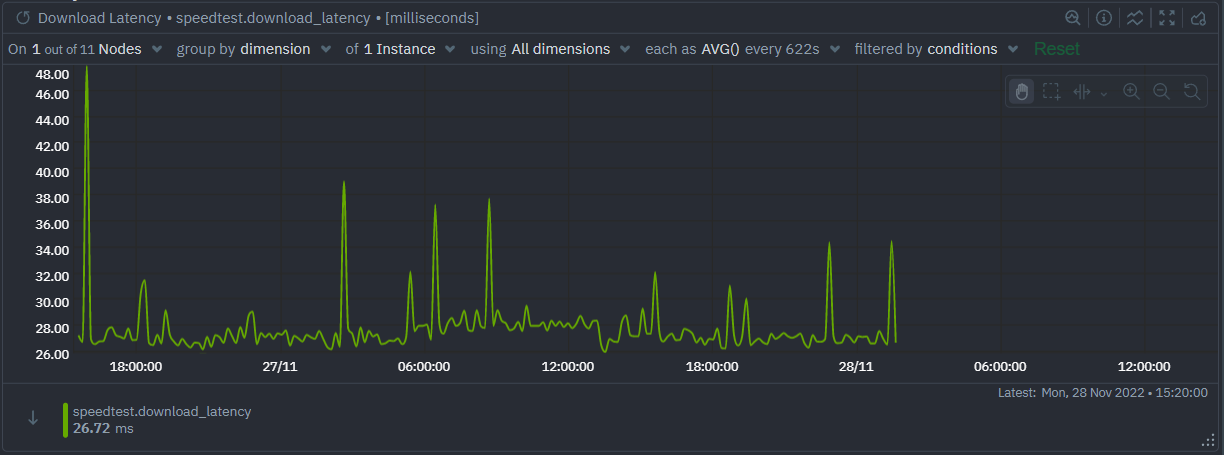
Latency (sometimes called "ping") measures how quickly your device gets a response after you’ve sent out a request. As internet speeds have steadily increased globally, latency issues have become easier to spot. Latency directly correlates with the quality of experience when it comes to latency sensitive applications like video calls, live streaming, and especially online gaming.
Three distinct latency metrics are collected to give a more fine grained understanding of potential bottlenecks in the network:
- Idle Latency is measured at the beginning of a speed test while the network is (relatively) not in use.

- Download Latency is measured while the download test is in progress to see how it is affected by download activity on your network, like a household member downloading a large game while you’re trying to work.

- Upload Latency is measured while the upload test is in progress to see how it is affected by upload activity on your network, like someone on your home network uploading a year’s worth of photos.

How do I solve latency problems?
- If your idle latency is high, you have an overall latency problem. Try running speedtest on another device, and, if you see the same problem try restarting your router. If the problem continues, consider moving your router someplace more central.
- If your download or upload latency is high, check your router/network configurations and/or contact your internet service provider (ISP) to see if they can help.
Jitter
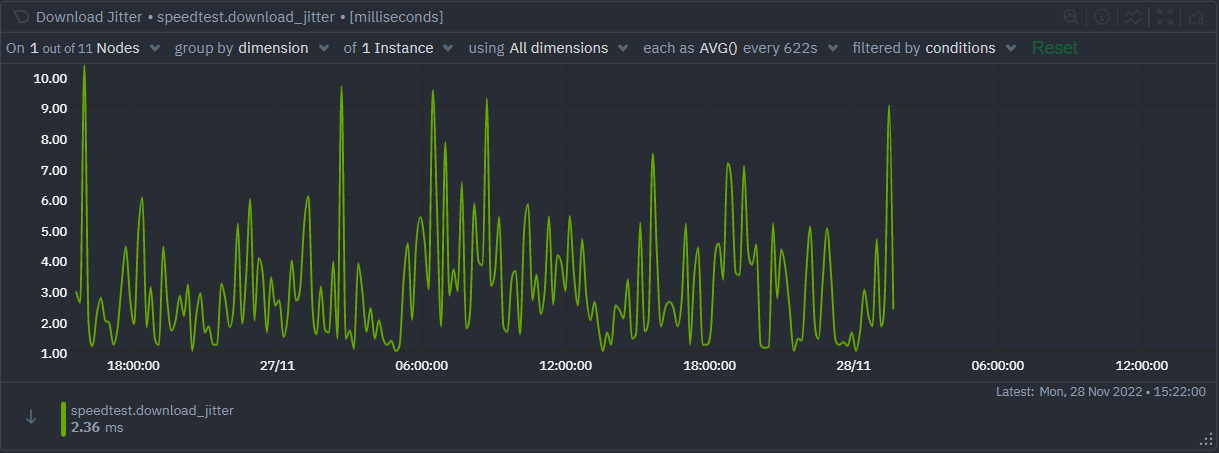
Network jitter is the variance in latency between data packets. Basically, if it's pretty stable from packet to packet, you have minimal jitter. If there are random spikes that deviate from the usual numbers you're getting, you've got some jitter. For many users jitter is not something that will be very noticeable, but there are certain scenarios such as interactive gaming where jitter could be very troublesome.
Similar to latency, three distinct jitter metrics are collected.
- Idle Jitter is measured at the beginning of a speed test while the network is (relatively) not in use.

- Download Jitter is measured while the download test is in progress to see how it is affected by download activity on your network.

- Upload Jitter is measured while the upload test is in progress to see how it is affected by upload activity on your network.

How do I minimize jitter?
- First check if it is a momentary problem or a more longer term issue, Netdata's jitter time series chart should help you do this. You may notice momentary issues due to, for example, heavy load, that may go away on its own.
- Prefer using an Ethernet cable whenever possible
- And if you must use Wi-Fi, prefer the less congested 5 GHz band and move closer to your router to minimize transmission distance, noise, and signal loss
- Try restarting your wireless router to have it automatically reconnect to the least congested channel available
- Check your router/network configurations and/or try contacting your ISP.
Bytes consumed
Bytes consumed is the measure of how many bytes of data have been downloaded and uploaded as part of the speed tests we’re running. It’s good to keep an eye on this because speed tests can be quote bandwidth hungry and if you’re not on an unlimited plan things might get ugly.


Troubleshooting with Netdata
Netdata can do a lot more than monitor metrics and visualize it for you, it comes with powerful troubleshooting features such as:
Alerts
Netdata has built-in support for alerts to reduce the monitoring burden for you. To create your own alert for another metric – please follow the instructions here.
For example, you could set up trigger actions when an alert condition is met. A few years ago I was having some trouble with an ISP under delivering and wrote a script that auto tweeted complaints to my ISP's twitter account every time my internet misbehaved due to network issues. I'm not suggesting you do that, but I'm not suggesting you don't do it either :-)
Anomaly Advisor
Anomaly Advisor lets you quickly identify if the system you are monitoring has any anomalies and allows you to drill down into which metrics are behaving anomalously.
To learn more about how to use Anomaly Advisor to troubleshoot your Apache web server check out the documentation or visit the anomalies tab in the demo space to play with it right now.
Metric Correlations
Metric Correlations lets you quickly find metrics and charts related to a particular window of interest that you want to explore further. By displaying the standard Netdata dashboard, filtered to show only charts that are relevant to the window of interest, you can get to the root cause sooner.
Let us hear from you
So don't suffer in silence next time your internet is slow. Take a stand and demand the speeds you deserve!
If you haven’t already, sign up now for a free Netdata account!
We’d love to hear from you – if you have any questions, complaints or feedback please reach out to us on Discord or Github.
Happy Troubleshooting!